Japan: Increase in Seismic Activity in Ishikawa Prefecture in 2024 and in Tōhoku region in 2025
On New Year’s Day 2024, the Noto Peninsula was struck by an M 7.5 earthquake in a zone where such strong shocks were not expected. It represents one of the largest intraplate earthquakes in Japan. Earthquake swarms had been occurring there for three years, and this is the first magnitude M 7 earthquake within swarm activity since 19191.
The graph in Figure 1 illustrates an extraordinary increase in seismic activity in Japan in Ishikawa Prefecture for the year 2024, while Figure 2 shows the localization of earthquakes with M4+ in Ishikawa Prefecture in 2024.2
The VolcanoDiscovery database was chosen for analysis of seismic activity in this area mainly because it contained the highest number of recorded earthquakes compared with the USGS and ISC databases. In some years, the number of recorded events in this database was even approximately double.
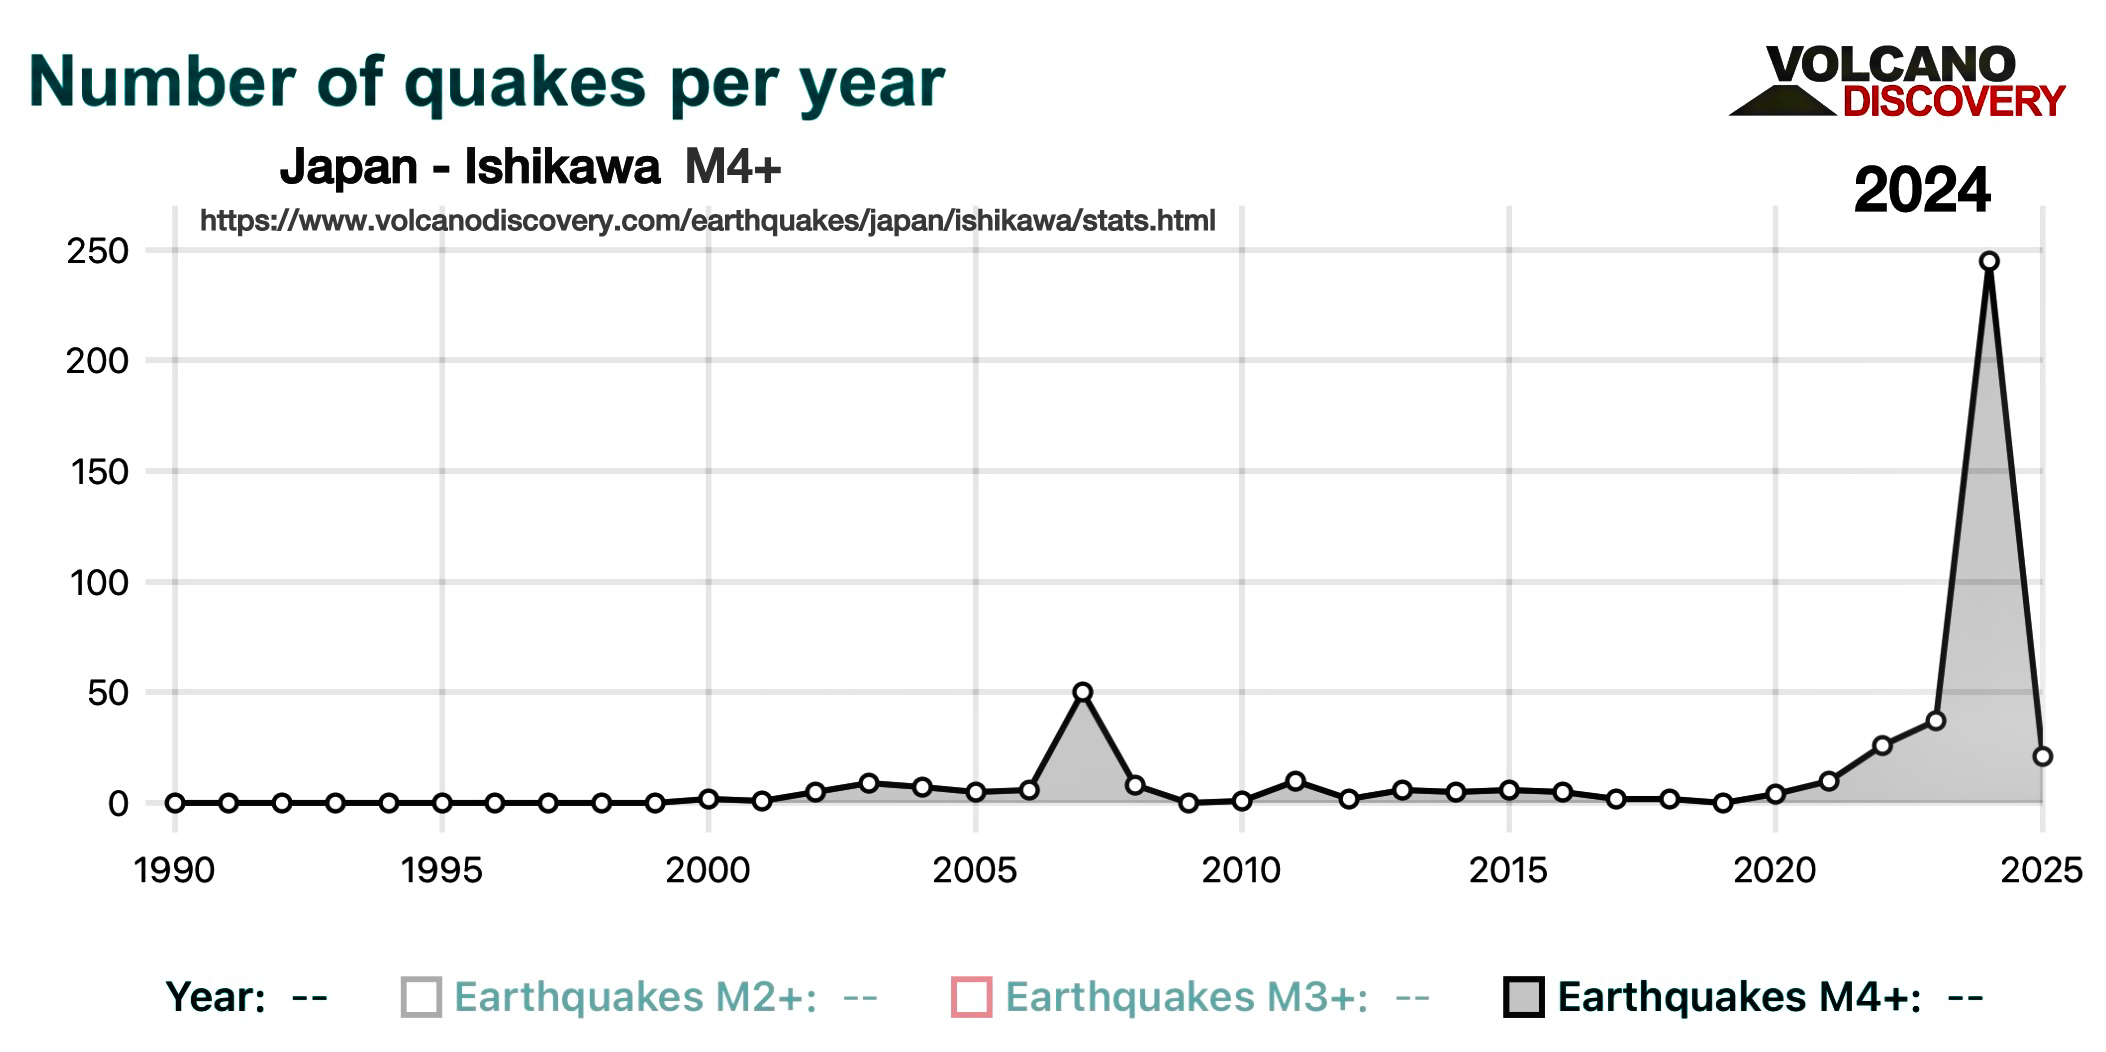
Fig. 1: Number of earthquakes with M ≥ 4 in Japan in Ishikawa Prefecture since 1990. Source: https://www.volcanodiscovery.com/earthquakes/japan/ishikawa/stats.html
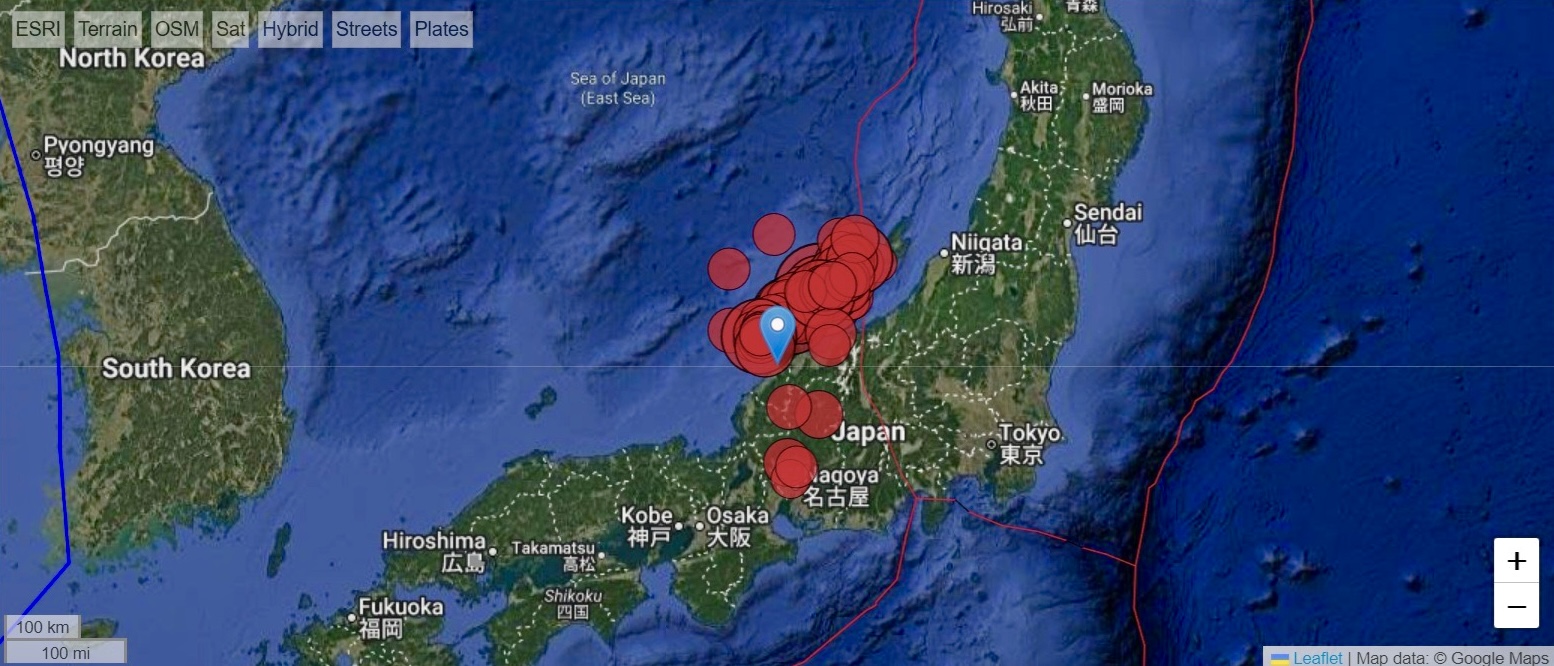
Fig. 2: Localization of earthquakes with M4+ in Japan in Ishikawa Prefecture for 2024. Source: https://www.volcanodiscovery.com/earthquakes/japan/ishikawa/stats.html
The Noto Peninsula lies outside the main fault interfaces of Japan, in a zone of internal deformation between the Okhotsk Plate and the Amurian block (part of the broader Eurasian plate). For this reason, such large earthquakes occur here only rarely. Most of Japan’s strongest earthquakes originate along plate boundaries—especially along the fault zones of the Pacific and Philippine plates. The M 7.5–7.6 earthquake of January 1, 2024 is therefore an exceptional intraplate earthquake that occurred in an area where shocks of this magnitude had long not been expected, despite the ongoing swarm activity. It is the strongest earthquake to hit Ishikawa Prefecture since 1885.3
In addition, on December 8, 2025, an earthquake with magnitude M 7.6 occurred off the coast of Tōhoku in Aomori Prefecture. Both of these events belong to the strongest earthquakes recorded in Japan since 2011 (Tōhoku M 9.0–9.1)4 and occurred within a relatively short time interval, each affecting a different part of the country. The fact that the two strongest seismic events in more than a decade after the Tōhoku megathrust earthquake occurred in different tectonic environments of Japan points to persistent and spatially widespread seismic activity across the Japanese archipelago.
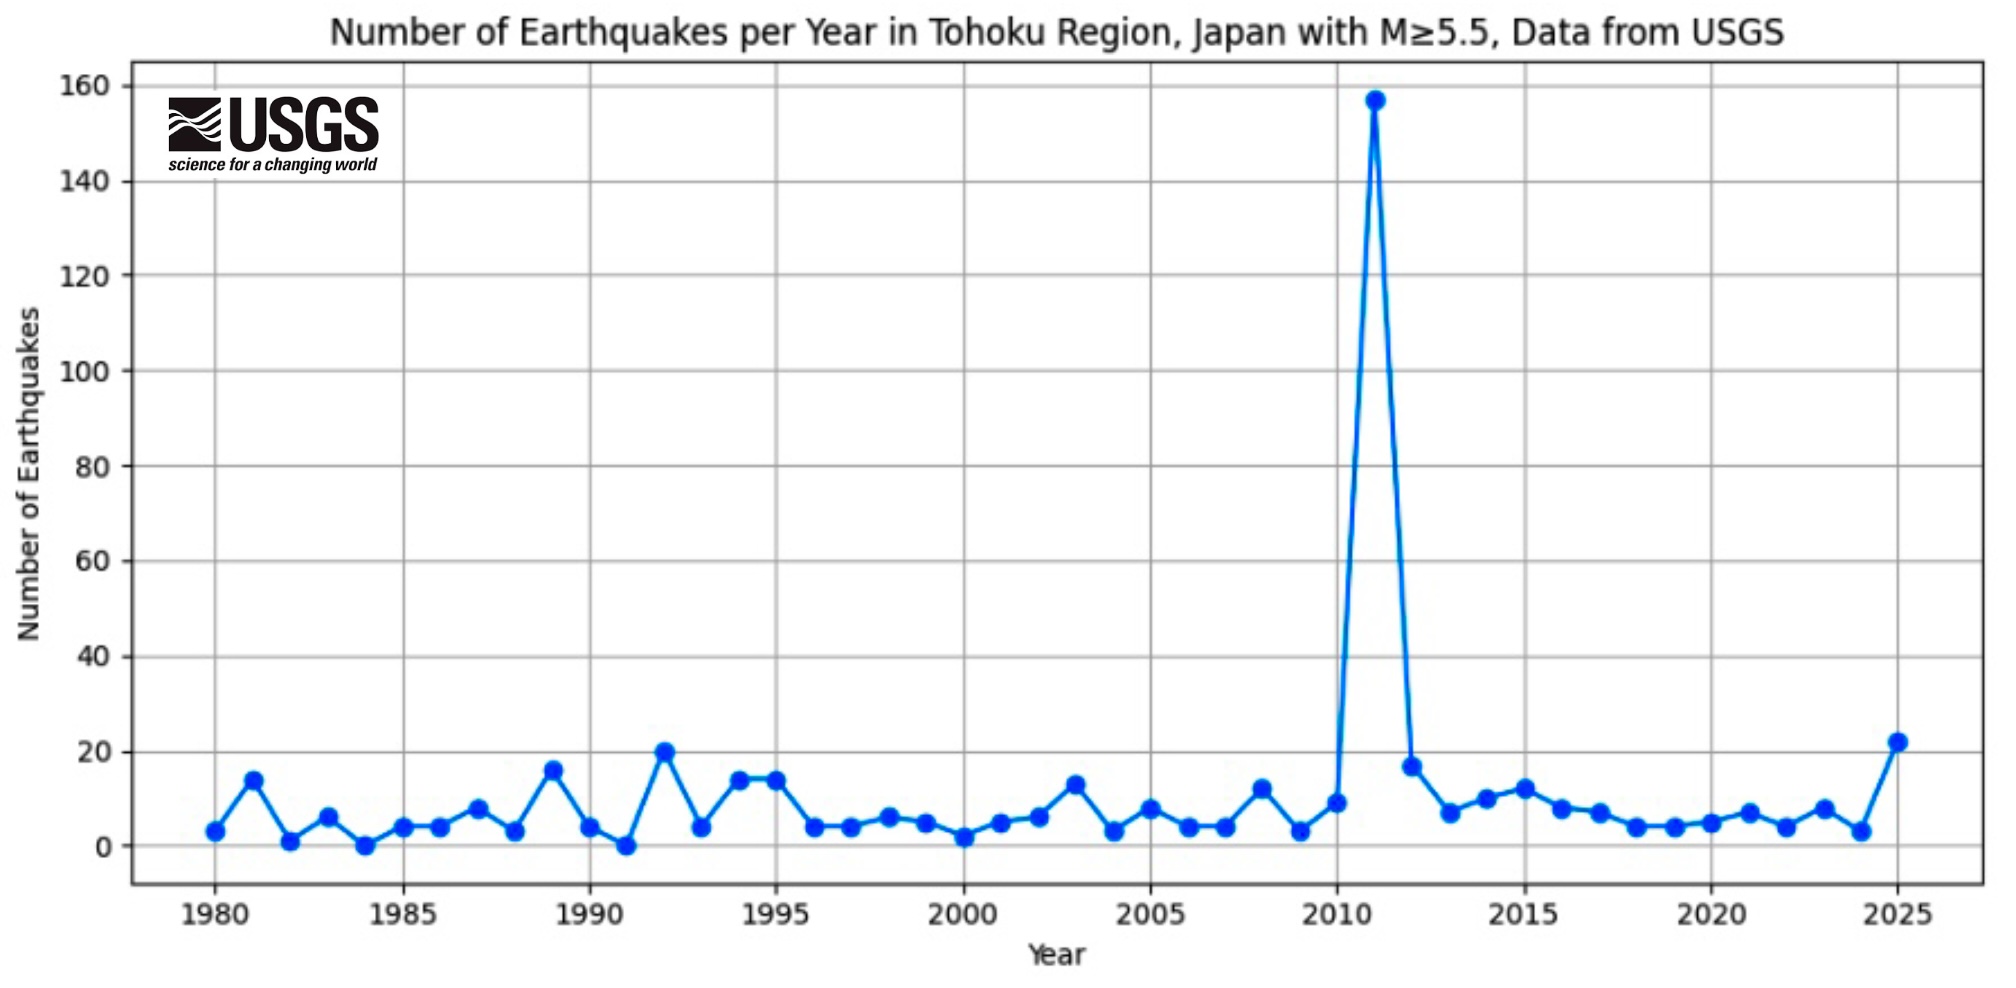
Fig. 3: Number of earthquakes with M ≥ 5.5 in Japan in the Tōhoku region since 1980, data source: https://earthquake.usgs.gov/earthquakes/search/
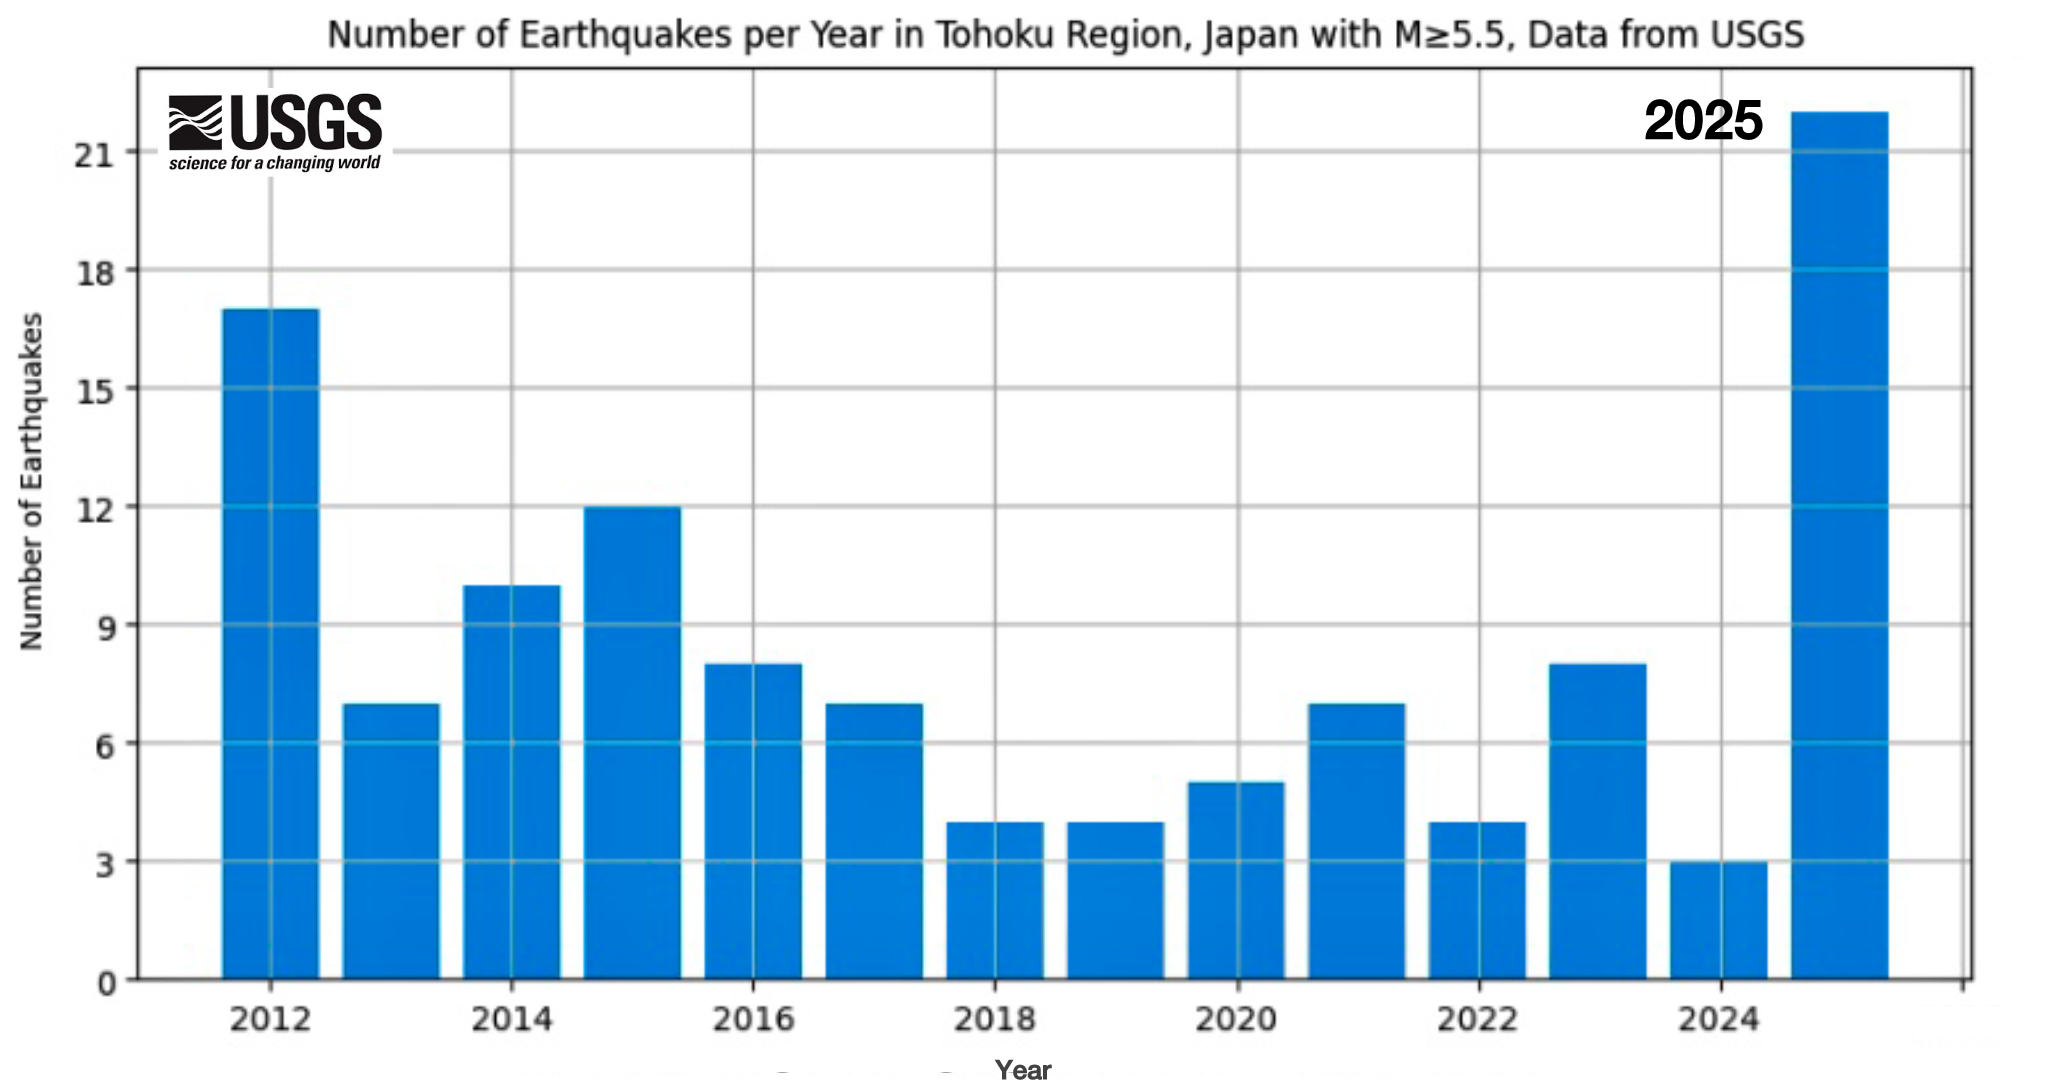
Fig. 4: Number of earthquakes with M ≥ 5.5 in Japan in the Tōhoku region since 2012, data source: https://earthquake.usgs.gov/earthquakes/search/

Fig. 5: Analyzed zone in Japan – Tōhoku region, source: Google Earth, own modification
The graphs in Fig. 3-4 show the long-term evolution of seismic activity in the Tōhoku region for earthquakes with magnitude M ≥ 5.5 and clearly point to the exceptional character of the current year. The absolute maximum in the time series is the year 2011, which was a direct consequence of the Tōhoku megathrust earthquake (M 9.0) and its extensive aftershock sequence. After this period, seismicity declined significantly and in subsequent years remained at a relatively stable, low level, with only minor fluctuations. The magnitude threshold of M ≥ 5.5 was chosen because earthquakes of this size represent the upper end of the moderate earthquake category. This threshold also provides a sufficient number of events for statistical analysis, while excluding the large number of smaller aftershocks typical of large megathrust earthquakes, such as the 2011 Tōhoku earthquake. Figure 5 shows the boundaries of the analyzed zone on the map.
However, the current year shows the highest number of strong shocks (M ≥ 5.5) since the end of the main aftershock phase after 2011. As shown by the detailed bar graph of recent years (Figure 4), this represents a significant increase compared with the previous decade and has no equivalent since 2011 or even before it. This increased seismicity suggests renewed activation of stress processes in the fault zone between the Pacific and Okhotsk plates, as well as in associated fault systems in northeastern Japan. Although this is not a megathrust earthquake comparable to that of 2011, the extent and frequency of strong events make the current year the most seismically significant period in the region in more than a decade.
References:
Chen, Y. et al. (2025) “Coseismic slip model and early post-seismic deformation processes of the 2024 M7.5 Noto Peninsula, Japan earthquake revealed by InSAR and GPS observations,” Geophysical Journal International, 240(2), pp. 1048–1063. Available at: https://doi.org/10.1093/gji/ggae429.
Earthquake statistics: Ishikawa-ken, Japan - detailed charts and tables, current and past seismic activity. Available at: https://www.volcanodiscovery.com/earthquakes/japan/ishikawa/stats.html (Accessed: March 16, 2026).
“Earthquake Lifts the Noto Peninsula - NASA Science” (2024), 25 January. Available at: https://science.nasa.gov/earth/earth-observatory/earthquake-lifts-the-noto-peninsula-152350/ (Accessed: March 16, 2026).
List of major earthquakes since the Great East Japan Earthquake (2025) nippon.com. Available at: https://www.nippon.com/ja/features/h20002/ (Accessed: March 16, 2026).