Global Increase in Volcanic Activity
Since 1968, the Global Volcanism Program (GVP) has continuously collected global historical and current data on volcanic activity, which form the basis of the Volcanoes of the World database and related online databases. This system includes records of eruptions, volcano types, and their activity over the past approximately 10,000 years, making it one of the most comprehensive sources of information on volcanism in the world.1
The GVP also integrates external data, including satellite measurements such as sulfur dioxide (SO₂) concentrations2 or monitoring of changes in tree color from NASA satellites3. The collaboration between the Smithsonian Institution and NASA thus significantly contributes to more accurate monitoring and understanding of global volcanic activity, with modern satellite technologies enabling the tracking of eruptions in near real-time even in remote areas of the world.
The history of systematic monitoring of global volcanic activity using satellite systems (through detection of thermal anomalies) dates back to the 1970s, when AVHRR (Advanced Very-High-Resolution Radiometer) sensors were placed on NOAA satellites. In the years 1999–2002, the launch of the MODIS system on the Terra satellite in 1999 and later on the Aqua satellite in 2002 represented an improvement in global volcano monitoring because they enabled daily thermal imagery with global coverage.4
The following graph in Fig. 1 shows the total number of days with recorded volcanic activity on the planet for individual years based on the database of the Smithsonian Institution – Global Volcanism Program (GVP). This metric represents a time-integrated indicator of global volcanic activity, which includes the number of eruptions, their duration, and the simultaneous activity of multiple volcanoes, and is suitable for comparing the level of recorded activity between individual years.
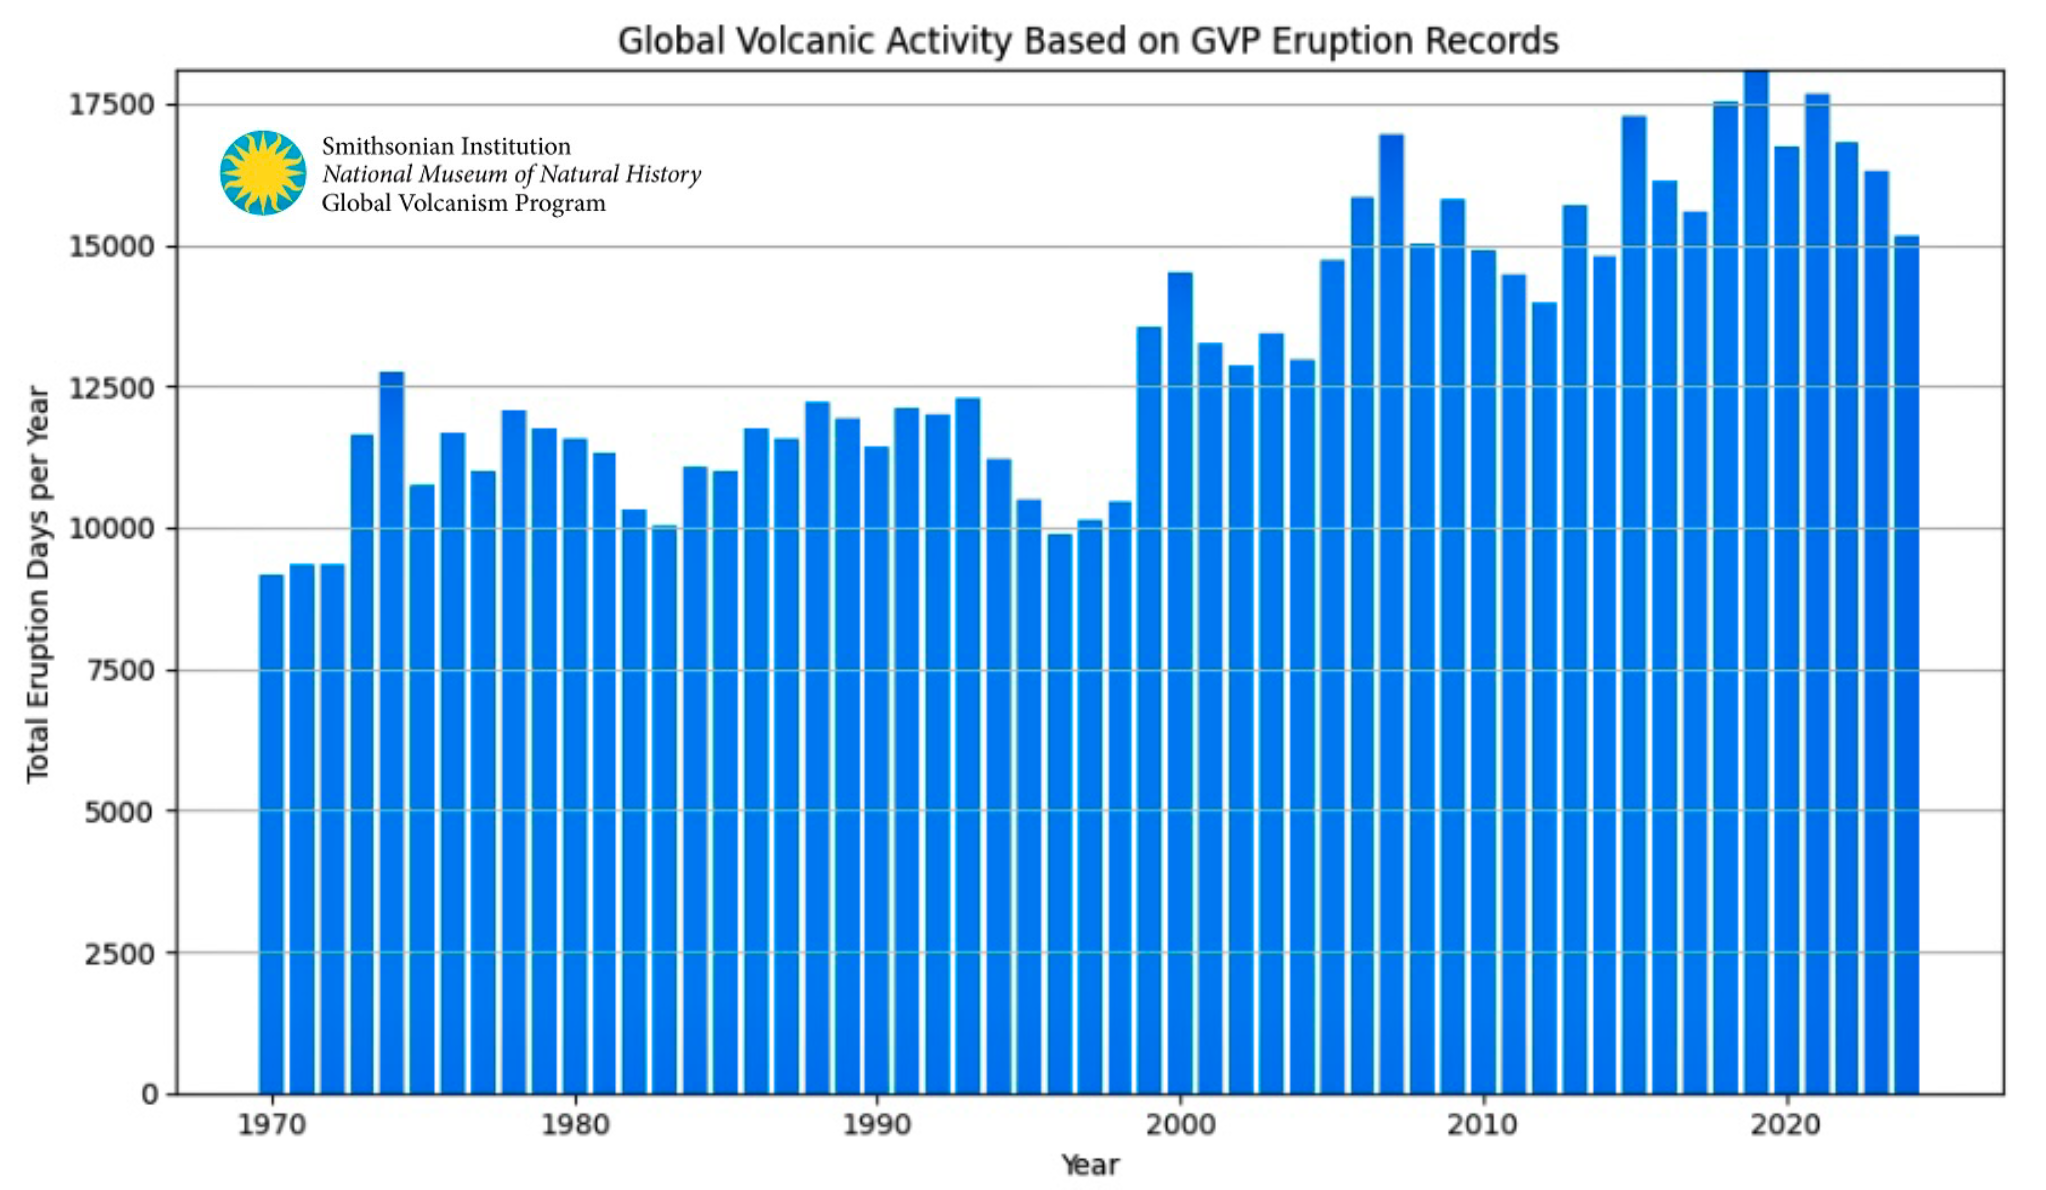
Fig. 1: Global increase in volcanic activity in the world. The graph was created in Python using data from the Global Volcanism Program, Smithsonian Institution: https://volcano.si.edu/gvp_votw.cfm
The graph shows the annual total number of days during which volcanic eruptive activity was observed across the entire planet according to data from the Global Volcanic Program (GVP) from 1970 to 2024. Since the mid-1970s, a long-term increase is visible, though it consists of several sudden jumps after which activity stabilizes at a higher level. It is important to distinguish between monitoring artifacts and probable real episodes of increased global activity.
The first significant increase in 1973–1974 occurs before the era of modern satellite monitoring. During this period, the GVP database was already systematically collecting global information about eruptions through ground observatories and reports, but without unified remote monitoring. This jump therefore cannot be explained by technical improvements in detection and more likely reflects a genuinely high level of simultaneously occurring eruptions at multiple volcanoes.
Similarly, increases in 2005–2007, 2015, and 2018–2019 occur during a period when global detection of eruptions from satellites (MODIS, OMI, later VIIRS) was already sufficiently precise at the ±1 day level5. In these years it is therefore not relevant to explain the increases simply as improved observation—the upward jumps with high probability reflect real periods of an increased number of simultaneously active volcanoes and longer-lasting eruptions.
An exception is the year 1999, where caution is appropriate. This increase coincides in time with the launch of the Terra satellite (MODIS), which represented an improvement in global and systematic monitoring of thermal activity. It is therefore possible that at this point the data reflect a combination of real activity and a step improvement in detection, especially for remote and long-persistently active volcanoes. After 2000, however, the curve behaves more consistently and subsequent increases can no longer easily be attributed to technological changes. Overall, the graph suggests that global volcanic activity does not evolve linearly but in episodes, some of which—especially after 2005—likely represent genuine global intensification of volcanic activity rather than merely a better view of the same phenomenon.
References:
Secretariat of the Pacific Regional Environment Programme (2021) “Volcanoes of the World - Global Volcanism Program”. Available at: https://fsm-data.sprep.org/dataset/volcanoes-world-global-volcanism-program (Accessed: March 16, 2026).
NASA/GSFC/SED/ESD/TISL/GESDISC (2025) Multi-Satellite Air Quality Sulfur Dioxide (SO2) Database Long-Term L4 Global V2 (MSAQSO2L4) at GES DISC - NASA Open Data Portal. Available at: https://data.nasa.gov/dataset/multi-satellite-air-quality-sulfur-dioxide-so2-database-long-term-l4-global-v2-msaqso2l4-a-d5d7e (Accessed: March 16, 2026).
World Economic Forum “NASA tracks volcanic eruption signs from space”. Available at: https://www.weforum.org/videos/nasa-volcanic-eruptions/ (Accessed: March 16, 2026).
“Advanced Very-High-Resolution Radiometer” (2025) Wikipedia. Available at: https://en.wikipedia.org/w/index.php?title=Advanced_Very-High-Resolution_Radiometer&oldid=1330309367 (Accessed: March 16, 2026).
“Sensing Remote Volcanoes - NASA Science” (2004). Available at:https://science.nasa.gov/earth/earth-observatory/sensing-remote-volcanoes/ (Accessed: March 16, 2026).