Global Increase in Seismic Activity Worldwide
When evaluating the long-term development of global seismic activity, threshold magnitudes of M ≥ 4.4 and M ≥ 4.5 were selected for more detailed analysis. According to historical global coverage of seismic networks, these magnitudes represent the level from which earthquakes have been reliably recorded in most regions of the world over the long term.
As stated in an analysis by the USGS network (NEIC) from 1998, the magnitude completeness thresholds for most regions of the world fall within the range M 4.3–4.41. The authors examined data from all 50 regions originally proposed by Gutenberg and Richter (1954) and later formalized by Flinn and Engdahl (1965). The division into 50 seismic regions represents a global classification of the Earth into large tectonic-seismic areas in order to allow systematic comparison of seismicity among different parts of the planet within a unified global framework.
Earthquakes M ≥ 4.4
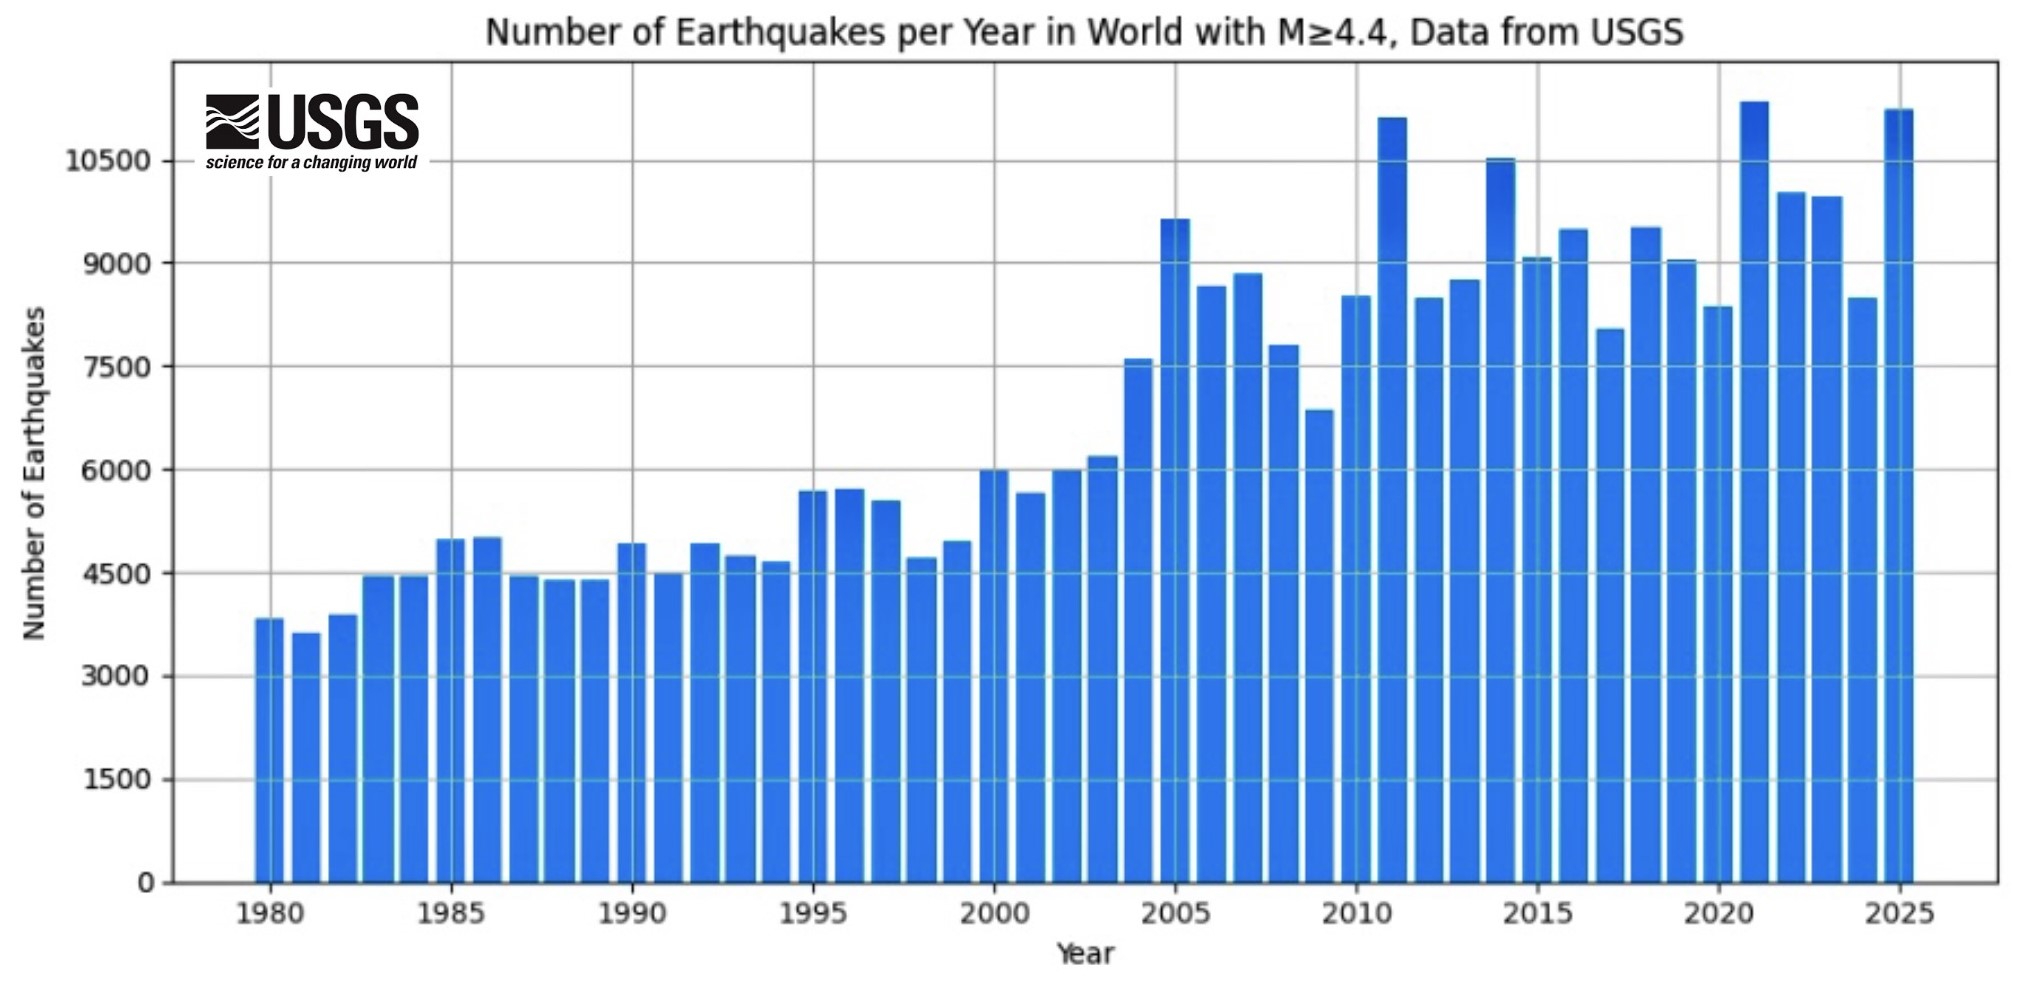
Fig. 1: Global increase in earthquakes with M ≥ 4.4. The graph was created in Python using data from the USGS catalog: https://earthquake.usgs.gov/earthquakes/search/
The graph in Fig. 1 shows the annual number of globally recorded earthquakes with magnitude M ≥ 4.4 for the period 1980–2025 based on data from the USGS catalog. This threshold value was selected with regard to analyses of the completeness of seismological catalogs, according to which the global completeness threshold of the NEIC catalog (USGS) lies approximately in the range M ≈ 4.4–4.5. Using magnitude M ≥ 4.4 therefore makes it possible to include a larger number of events while maintaining approximate global representativeness of the data.
The graph clearly shows that the number of recorded earthquakes of this magnitude has been gradually increasing since the mid-1990s. This increase is not exclusively related to improvements in global seismic monitoring but reflects the real seismic activity of the planet. Since around 2005, annual event counts have been significantly higher than during the 1980s and 1990s. A particularly interesting phenomenon is the development in recent years, during which relatively dense seismic activity can be observed. The highest number of events (11,353) was recorded in 2021, while the year 2025 represents the second-highest number of recorded earthquakes (11,211) within the entire analyzed time interval.
It should also be noted that the USGS ComCat catalog is a dynamic database that is continuously updated based on data from global and regional seismic networks. Event parameters may be revised afterward, and older events may also be retrospectively added to the catalog. For this reason, the final number of earthquakes for the most recent years may still change slightly, and it is possible that the number of events recorded in 2025 may increase somewhat in the future.
Earthquakes M ≥ 4.5
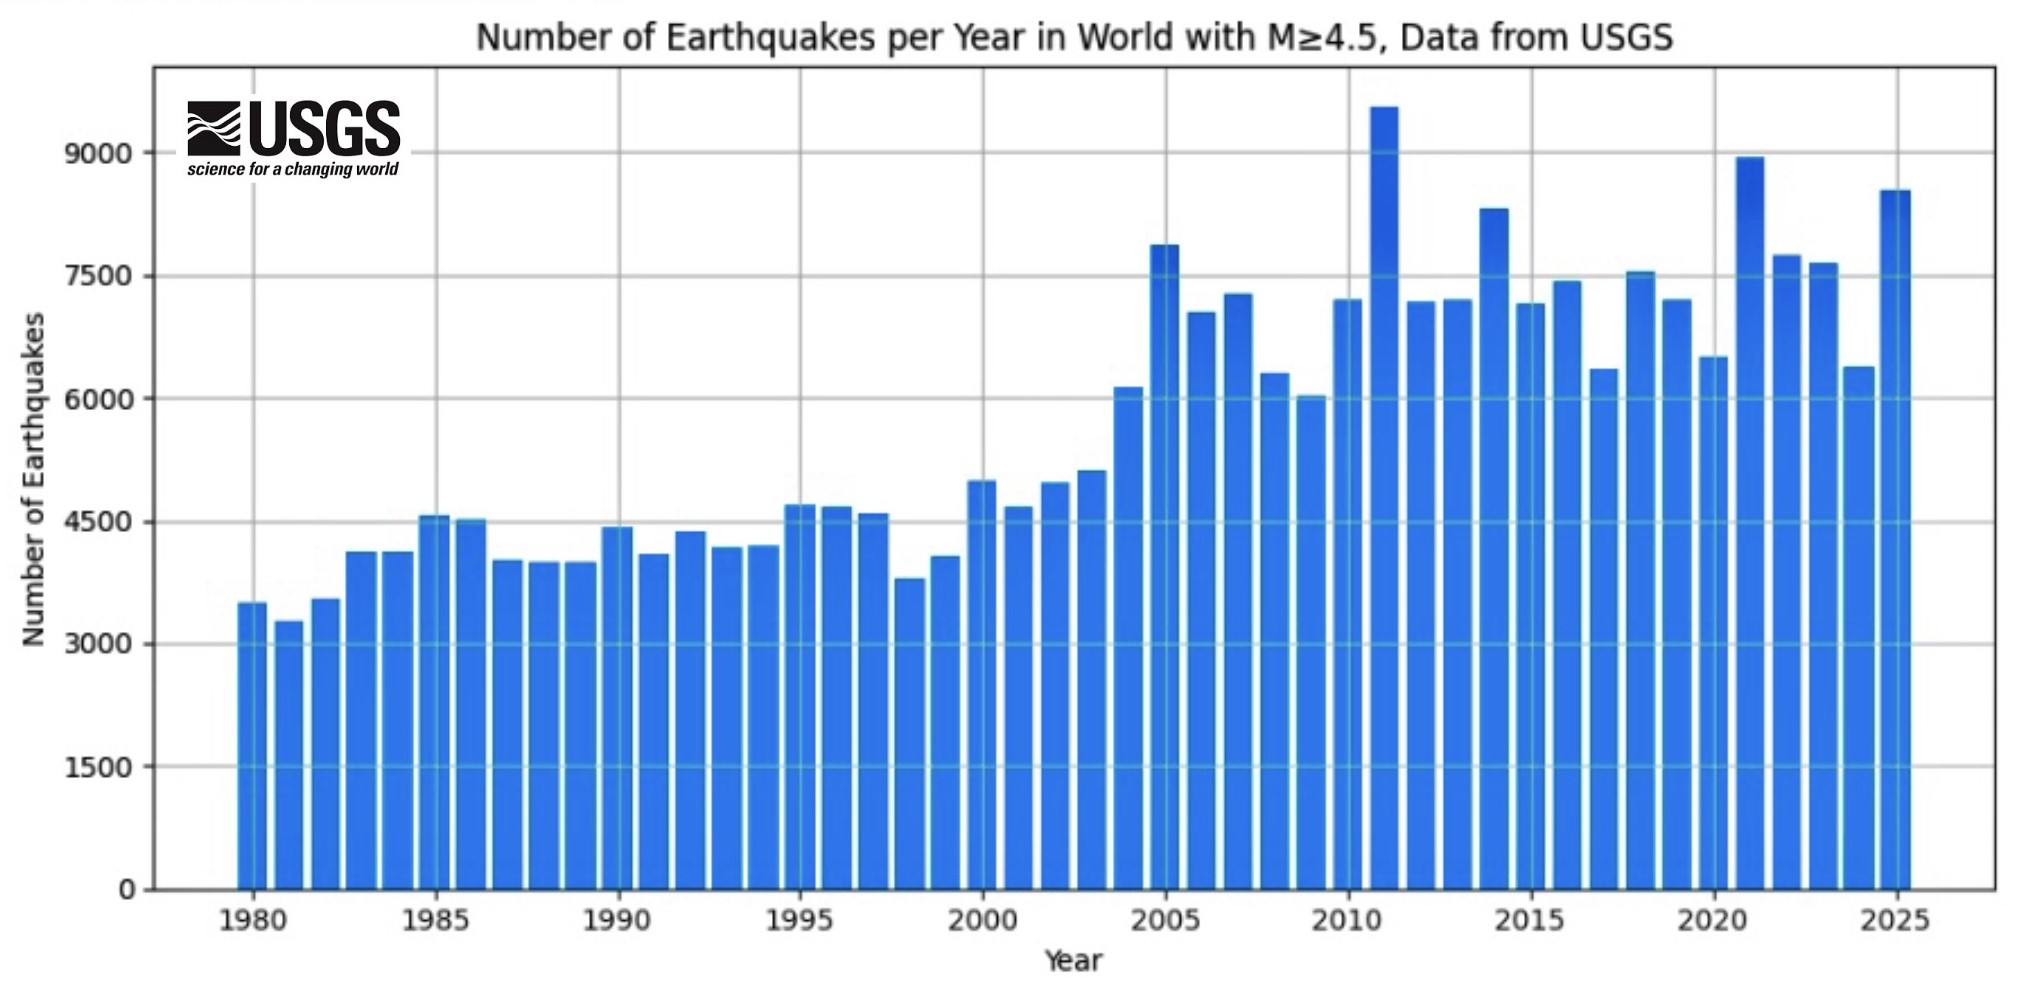
Fig. 2: Global increase in earthquakes with M ≥ 4.5. The graph was created in Python using data from the USGS catalog: https://earthquake.usgs.gov/earthquakes/search/
A similar picture is provided by the graph in Fig. 2 for M ≥ 4.5, which represents an even stricter threshold of reliable global detection. Even at this magnitude limit, a shift toward higher annual event counts can be observed after the turn of the millennium compared with the 1980s and 1990s, while recent years show increased variability at a higher baseline level. After 2004, a noticeable increase in the number of recorded events occurred, and in subsequent years the values stabilized at significantly higher levels than in previous decades. In recent years, annual counts have repeatedly been among the highest values of the entire time series, with 2025 ranking among the clearly above-average years of the observed period. This confirms that the increased number of recorded events is also evident at magnitudes that have long been reliably detected globally.
The fact that a similar increase in the number of events is also observed for magnitudes M ≥ 4.4 and M ≥ 4.5, in a range that, according to USGS analyses, has been considered nearly fully recorded globally since the 1990s, suggests that the increase in the number of recorded earthquakes in recent decades cannot be explained by improvements in detection technologies. In particular, the increased values in recent years, including the second historical maximum for M ≥ 4.4 in 2025, point to a significant level of current recorded global seismic activity.
Earthquakes M ≥ 7
The diagrams in Fig. 3 and Fig. 4 from a peer-reviewed study published in Geophysical Research Letters (AGU)2 show the global annual distribution of earthquakes with magnitude M ≥ 7 during the period 1979–2014.3. Each point in Fig. 3 represents an individual strong earthquake, with the x-axis representing time and the y-axis representing its magnitude. The annual occurrence rate of these events is also shown (Fig. 4).
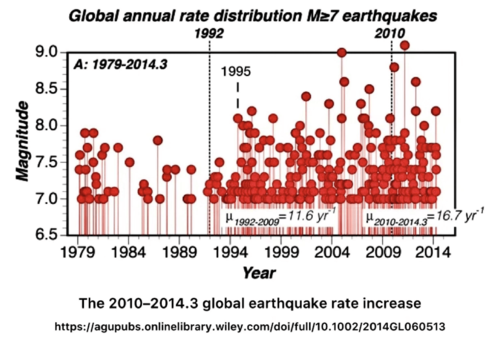
Fig. 3: Global temporal distribution of earthquakes with magnitude M ≥ 7.0 since 1979, source: https://agupubs.onlinelibrary.wiley.com/doi/full/10.1002/2014GL060513
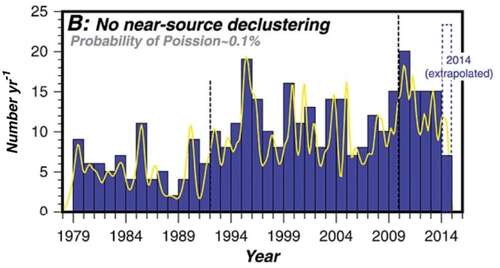
Fig. 4: Annual histogram of earthquakes with magnitude M ≥ 7.0 since 1979, source: https://agupubs.onlinelibrary.wiley.com/doi/full/10.1002/2014GL060513
At first glance, a clear break around the year 1995 is visible. Before this period, strong earthquakes of M 7+ are relatively rarer and more evenly distributed over time. After 1995, however, a significant increase in frequency occurs, which the authors also quantify statistically:
for the period 1992–2009, the average occurrence rate is approximately 12 events per year,
whereas in the period 2010–2014.3 it already reaches 17 events per year.
In addition to the break around 1995, the graph also shows another strengthening trend after 2010, when not only does the number of events increase, but a higher concentration of very strong earthquakes (M 8+ and occasionally close to M 9) also appears. This period shows an increased “density” of points, suggesting that it is not merely random fluctuation but a change in the regime of global seismic activity.
Importantly, improvements in measurement technology or the density of seismic stations do not play a role for earthquakes with magnitude M ≥ 7—these events have been reliably recorded since the beginning of the last century. The observed increase therefore points to a real global phenomenon.
The graphs thus provide strong evidence that the increased seismic activity in recent decades does not concern only weaker earthquakes (M 4+), but also affects the strongest and most energetically significant events, with key transitional periods around the years 1995 and 2010.
Development of the Global Seismic Network
Modern global monitoring began with the creation of the Global Seismographic Network (GSN), which started to be developed in the 1980s and 1990s as a digital network of approximately 150 high-quality seismic stations evenly distributed across the planet. The GSN transmits data in real time and serves as the core of modern global seismic monitoring, with its stations providing consistent and highly sensitive records of earthquakes across a wide range of magnitudes.3 4
Thanks to the gradual development of global seismic networks—especially systems such as WWSSN and its later digital successors such as the GEOSCOPE and GSN networks—the ability to detect weaker earthquakes globally improved significantly during the second half of the 20th century. Analyses of global catalogs (e.g., ISC and NEIC) illustrate the gradual capture of earthquakes of various magnitudes worldwide.5
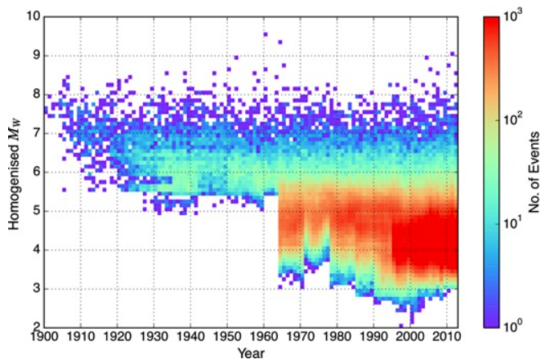
Fig. 5: Density of earthquake Mw magnitudes over time for the extended global ISC catalog up to 2013
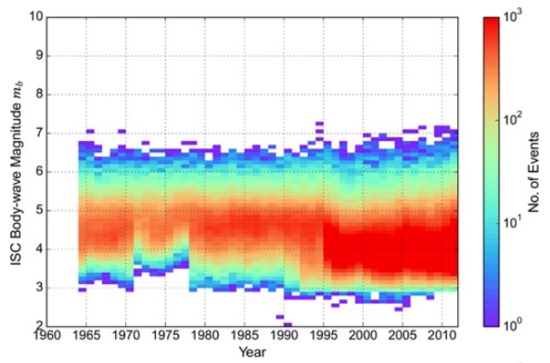
Fig. 6: density of earthquake mb magnitudes over time for the revised ISC bulletin
Source: https://academic.oup.com/gji/article/206/3/1652/2583518?login=false
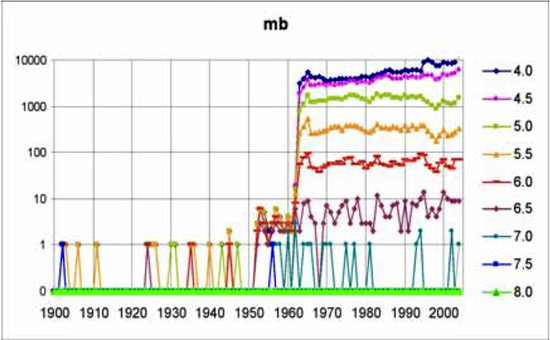
Fig. 7: annual number of mb earthquakes in the NEIC (USGS) catalog by time and magnitude, 1900–2004
Source: https://www.researchgate.net/publication/2178834_Does_the_Earth_show_up_an_impending_mega-earthquake#pf5
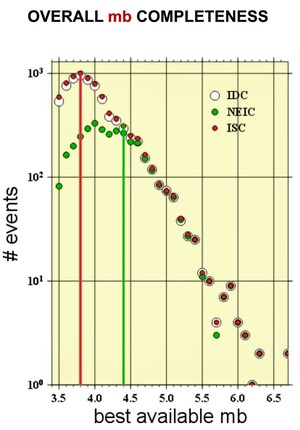
Fig. 8: overall completeness of mb magnitudes for different catalogs in 2001
The ISC bulletin is generally the most complete for mb; the magnitude threshold for the ISC bulletin is around mb 3.8, while for the NEIC (USGS) bulletin it is about mb 4.4.
Source: https://www.isc.ac.uk/docs/papers/download/2004p01/
Figures 5-8 illustrate the development of detection capabilities of global seismological catalogs and the estimate of the magnitude completeness Mc based on data from ISC, IDC, and NEIC (USGS). Fig. 5-6 show the temporal evolution of recorded earthquakes by magnitude. In the Fig. 5, events are expressed in moment magnitude Mw, while the Fig. 6 uses body-wave magnitude mb, which is often available even for older historical events. Both diagrams clearly show that as global seismic networks developed, the number of recorded weaker earthquakes increased significantly, reflected by a lowering of the detection threshold of catalogs, particularly from the second half of the 20th century.
Fig. 7 shows the development of earthquake counts in the NEIC (USGS) catalog according to various magnitude thresholds for the period 1900–2004. The graph shows a marked increase in recorded events since the 1960s, mainly associated with the development of the global seismic station network and the gradual lowering of the detection threshold.
Fig. 8 directly compares the completeness of the ISC, IDC, and NEIC catalogs for the year 2001. It shows that the ISC bulletin is generally the most complete, with a completeness threshold of approximately mb ≈ 3.8, while the NEIC (USGS) catalog has a higher completeness threshold of approximately mb ≈ 4.4. This value is very close to the boundary M ≈ 4.5, which is often considered in the literature to be the practical threshold for globally reliably recorded earthquakes in modern catalogs.
Based on the sources and data presented above, it can be inferred that the approximate completeness threshold of the NEIC (USGS) catalog globally lies in the range M ≈ 4.4–4.5, while reliable global detection of earthquakes of this magnitude can be assumed at least since the mid-1990s. The analyzed diagrams also indicate that earthquakes within this magnitude interval were recorded in global catalogs even in earlier periods.
The magnitude mb (body-wave magnitude) is based on the amplitude of primary seismic waves (P-waves) and in global seismological catalogs is often reported especially for older events, as it was long used as a standard in international bulletin systems, particularly for earthquakes of moderate intensity. In modern seismology, however, the moment magnitude Mw is increasingly used; it is derived from the physical seismic moment and more accurately characterizes the total energy of an earthquake. In the approximate range of M 4–5, however, mb and Mw values are in most cases very similar, with only a small difference between them. Therefore, when interpreting completeness thresholds of catalogs within this magnitude range, these values can be considered approximately comparable.
Justification for the Selection of Seismological Catalogs
When analyzing temporal changes in seismic activity, a key issue is the selection of an appropriate seismological catalog. Different databases differ in data-processing methodology, time coverage, types of magnitudes used, and completeness levels. In this work, the USGS catalog was primarily used, but other catalogs were also employed, complementing each other and enabling a more reliable assessment of regional seismicity. The selection of individual sources was based mainly on their availability, data-processing methodology, temporal coverage, and practical usability for statistical analysis.
USGS
The catalog of the United States Geological Survey (USGS) represents one of the most widely used sources of modern seismological data. In this work it was used primarily because of the focus on analyzing seismic activity in recent years, particularly within a time horizon of approximately the last 1–3 years. One of the characteristic features of this catalog is that earthquake data are continuously updated and refined. In the first hours to days after an event, records are based on rapid automatic solutions, which are later supplemented with more precise locations and revised magnitude values. As a result, the number of earthquakes recorded in recent years may slightly increase in the future as additional identified events are added to the catalog or parameters of already registered earthquakes are updated.
An advantage of the USGS catalog is its high transparency and easy verifiability of data. The data are freely available through a web interface as well as through the FDSN (Federation of Digital Seismograph Networks) standard, which enables automated downloading of data and further processing in various analytical tools and programming environments (e.g., Python, MATLAB, or R). The catalog also uses a single preferred magnitude for each earthquake, which greatly facilitates statistical processing of the data. Compared with some more complex databases, it therefore provides relatively simple and directly usable data even for users without a deeper seismological background.
VolcanoDiscovery
The VolcanoDiscovery database was used mainly when analyzing seismic activity in specific regions of the world, where it contained a significantly larger number of recorded events than the USGS or ISC catalogs. This source aggregates data from various seismological services and allows earthquakes to be displayed according to different magnitude thresholds, most commonly M2+, M3+, and M4+, with time coverage for many areas extending back to 1990. For the purposes of this work, only earthquakes with magnitude M ≥ 4 were used from this database.
The main advantage of the VolcanoDiscovery database is its clear web interface, which allows rapid display of statistics, diagrams, and map overviews of seismic activity without the need to download and process the data. Such visualization tools can be particularly useful for quickly orienting oneself within regional seismicity.
On the other hand, this source also has significant limitations. A more detailed comparison showed that in some cases the catalog displays inconsistencies in the totals of earthquakes for individual countries or regions. In addition, in recent years there have been cases where the database retrospectively added a larger number of events to older time periods without a clear methodological explanation. These issues reduce the overall reliability of the database and require caution when interpreting its statistical outputs.
EMSC
The European-Mediterranean Seismological Centre (EMSC) operates an earthquake database focused primarily on Europe, the Mediterranean, and adjacent regions. Its systematic digital records are available approximately from 1998. The catalog integrates data from numerous national seismological services and provides rapid information about earthquakes, including their location, magnitude, and basic parameters.
In this work, the EMSC catalog was used mainly in areas where it provided denser or more complete records than other global databases. This applies especially to northern regions, specifically the area of Jan Mayen and Svalbard, where European seismic networks often record a larger number of weaker events than global catalogs. In such cases, the EMSC database can provide a more detailed picture of regional seismicity.
Why the ISC Bulletin Was Not Used
Although the ISC Bulletin catalog is often used in similar seismological analyses—mainly because of its high level of completeness and integration of data from a large number of global and regional seismic networks—it was not used as the primary data source in this work. The reason is the focus of the analysis on the most recent development of seismic activity in the past few years. The most recent years in the ISC Bulletin catalog have not yet undergone complete revision, and the final verification and merging of solutions from different seismic networks may take up to approximately two years. In unrevised data, temporary duplicates or parallel solutions of the same event from different agencies may therefore occur, which can lead to a slight overestimation of earthquake counts in the most recent years until the catalog is fully revised.
For this reason, the USGS ComCat (NEIC) catalog was used in this work for analyzing current seismic activity, as it provides rapidly updated and operationally processed data with a single preferred event solution, allowing a more consistent analysis of seismicity over the time horizon of recent years.
Using multiple catalogs in this work makes it possible to combine the advantages of individual databases—global coverage and ease of working with data in the case of USGS, visual accessibility of statistics in the VolcanoDiscovery database, and the regional accuracy of European EMSC data. Such an approach also reduces the risk of systematic errors that could arise from using only a single source of seismological data.
Evaluation of Available Data, Methodologies, and Physical Context
As this study shows, global seismological databases have recorded an increase in the number of moderate-magnitude earthquakes—roughly in the range of M 4 to M 5—over the past few decades.
Which Data Deserve the Most Attention
From the perspective of data interpretation, it is important to focus specifically on the M 4.0–M 5.0 magnitude range. If an early signal of a global change in the seismic regime were to exist, it would most likely manifest itself within this range. This is not a matter of microseismicity, but of events associated with the actual release of stress in the Earth’s crust. At the same time, this is a sufficiently large group of events to allow for robust statistical monitoring, and the magnitudes are sensitive to subtle changes in the stress field and deeper geodynamic processes. For this reason, global trends in the M 4–M 5 range after 2000 can be considered a relevant indicator—not as evidence of a fundamental change, but as a potential early signal that deserves systematic attention.
Regional Anomalies and Deep Processes
In addition to statistical trends, it is important to consider the broader physical context. In recent years, increased seismic swarm activity has been observed in various parts of the world, such as in areas like Campi Flegrei and Santorini. At the same time, there is evidence of long-term changes in magmatic systems, and our understanding of the dynamics of the planet’s deep interior is growing, including variations in the Earth’s core rotation and the interaction between the core and the mantle, which can manifest, for example, as changes in the magnetic field or the movement of the magnetic pole. Possible pulses of heat and material in the Earth’s mantle are also being discussed. These phenomena do not contradict current scientific knowledge, but they have not yet been integrated into a unified global model. It is therefore important to distinguish between something “not existing” and something that has not yet been sufficiently investigated or unequivocally proven.
The Gutenberg–Richter Law
It is also appropriate to interpret trends in seismicity within the framework of Gutenberg–Richter’s law, which describes the relationship between the magnitude of earthquakes and their frequency. This law states that as magnitude increases, the number of events decreases exponentially—typically by a factor of about ten for each one-unit increase in magnitude.
Basic formulation
The Gutenberg–Richter law describes the relationship between earthquake magnitude and their number:
where:
N = number of earthquakes with magnitude ≥ M
a = seismic activity of the region (overall “productivity”)
b ≈ 1 (typically between 0.8–1.2) – the ratio between small and large events
Practical meaning: for each increase in magnitude by 1, the number of earthquakes decreases approximately tenfold.
Why This Could Be Potentially Concerning
If it were true that the number of M 4+ earthquakes globally and genuinely increases and the b parameter remains stable, then inevitably, over a longer time horizon, the number of M 5 earthquakes, subsequently M 6, and eventually M 7+ must also increase. In other words, large earthquakes cannot “be absent forever” if the system truly becomes more active at lower magnitudes.
Given the current state of knowledge, it is therefore possible to draw several tentative conclusions. There is a growing body of evidence that cannot be easily explained by a single factor, especially when statistical trends in intermediate magnitudes, regional anomalies, and insights into deep geodynamic processes are taken into account. Regional and intraplanetary processes suggest that seismicity may have triggers other than just the movement of lithospheric plates. The M 4–M 5 magnitude range represents a relevant level at which potential global changes may first manifest themselves.
Today it is not scientifically correct to ignore the simultaneous occurrence of statistical trends in medium magnitudes, regional seismic swarms, and deep geodynamic changes. It is a situation that can perhaps best be described as a pre-paradigmatic phase: something that is not yet a consensus, but can no longer be dismissed as coincidence without further investigation.
Sources:
IRIS Newsletter: Volume 2000, No. 1 (2000). Available at: https://ds.iris.edu/news/IRISnewsletter/volume2000no1/page-02-04.htm (Accessed: March 16, 2026).
Parsons, T. and Geist, E.L. (2014) “The 2010–2014.3 global earthquake rate increase,” Geophysical Research Letters, 41(13), pp. 4479–4485. Available at: https://doi.org/10.1002/2014GL060513.
Ringler, A.T. (2022) “Global Seismic Networks: Recording the Heartbeat of the Earth,” Eos, 9 September. Available at: https://eos.org/editors-vox/global-seismic-networks-recording-the-heartbeat-of-the-earth (Accessed: March 16, 2026).
Achievements and prospects of global broadband seismographic networks after 30 years of continuous geophysical observations | U.S. Geological Survey (2022). Available at: https://www.usgs.gov/publications/achievements-and-prospects-global-broadband-seismographic-networks-after-30-years (Accessed: March 16, 2026).
Weatherill, G.A., Pagani, M. and Garcia, J. (2016) “Exploring earthquake databases for the creation of magnitude-homogeneous catalogues: tools for application on a regional and global scale,” Geophysical Journal International, 206(3), pp. 1652–1676. Available at: https://doi.org/10.1093/gji/ggw232.